Cabarrus County FY 2027 Adopted Budget
Budget Summary
Changes to the recommended budget, and the revenue and expenditure sections.
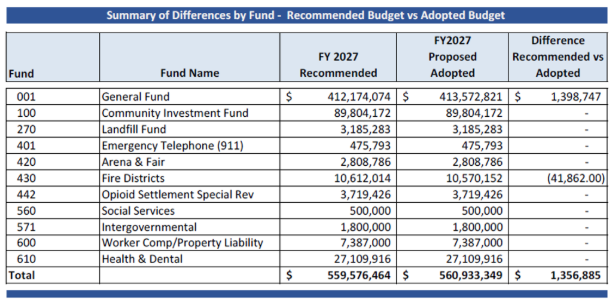
Changes to the Recommended Budget
The Annual Budget for FY 2027, adopted by the Board of Commissioners on June 15, 2026, was the Recommended Budget adjusted for technical adjustments to the financial plan. The following tables show the changes between the Recommended Budget and the Annual Adopted Budget:
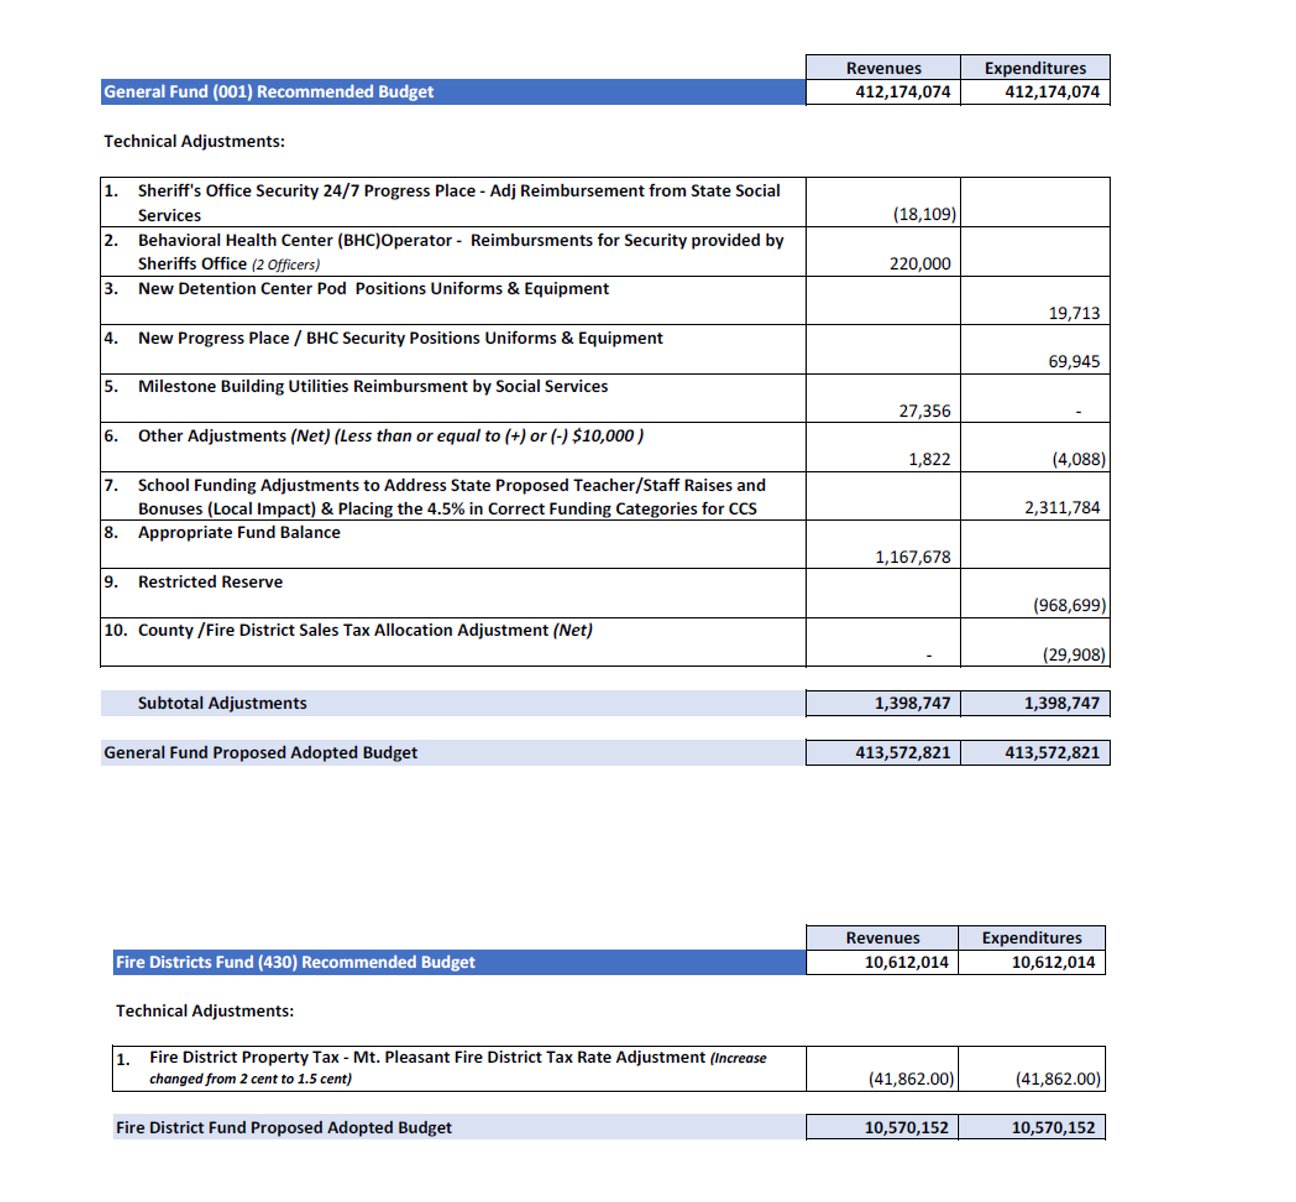
The technical adjustments made to each fund are summarized below:
Revenues
The County is committed to a strategic, conservative approach to budgeting revenues and expenditures. To estimate revenue for the coming year, the County Manager's Office and Finance Department consulted with the Tax Administrator, department heads, state agencies and economists. Staff reviewed revenue collection trends, anticipated growth and any known external factors prior to finalizing revenue projections.
The County receives revenue from many sources. The budget consists of the following revenue categories:
- Property Tax
- Sales/Other Taxes
- Other Financial Sources
- Sales & Services
- Intergovernmental - Grants/Other
- Permits & Fees
- Miscellaneous
- Investment Earnings
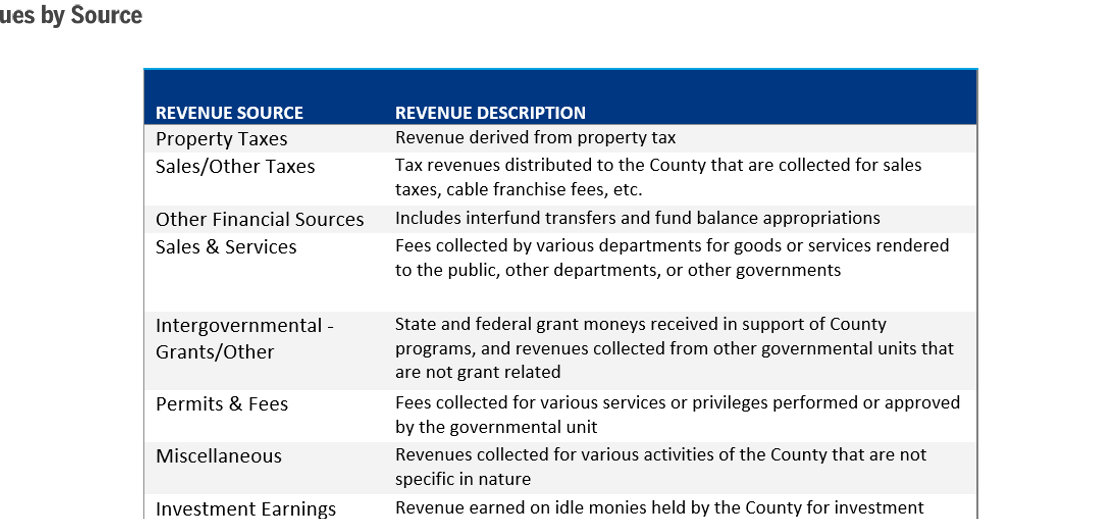
Revenues by Source
Revenue by Source - All Funds
| Revenue Source | 2024 - 25 Budget | 2025 - 26 Budget | 2026 - 27 Budget |
|---|---|---|---|
| Property Taxes | $278,830,878 | $289,716,746 | $297,210,967 |
| Sales/Other Taxes | $77,015,000 | $77,825,000 | $79,515,000 |
| Intergovernmental - Grants - Human Services | $20,555,532 | $21,789,947 | $21,249,663 |
| Intergovernmental - Grants - Other | $4,136,346 | $3,501,095 | $3,197,410 |
| Intergovernmental - Other | $6,618,650 | $6,616,650 | $6,600,650 |
| Permits & Fees | $9,047,350 | $9,832,880 | $9,708,270 |
| Sales & Services | $43,885,415 | $53,563,584 | $58,283,580 |
| Investments | $4,640,000 | $6,695,000 | $11,151,182 |
| Miscellaneous | $1,805,966 | $2,507,700 | $3,023,113 |
| Other Financing Sources | $50,457,415 | $75,596,874 | $70,993,514 |
| TOTAL | $496,992,552 | $547,645,476 | $560,933,349 |
Revenues and Expenditures by Source and Category
Revenues by source (all funds):
| Revenue Source | 2024 - 25 Budget | 2025 - 26 Budget | 2026 - 27 Budget |
|---|---|---|---|
| Property Taxes | $278,830,878 | $289,716,746 | $297,210,967 |
| Sales/Other Taxes | $77,015,000 | $77,825,000 | $79,515,000 |
| Intergovernmental - Grants - Human Services | $20,555,532 | $21,789,947 | $21,249,663 |
| Intergovernmental - Grants - Other | $4,136,346 | $3,501,095 | $3,197,410 |
| Intergovernmental - Other | $6,618,650 | $6,616,650 | $6,600,650 |
| Permits & Fees | $9,047,350 | $9,832,880 | $9,708,270 |
| Sales & Services | $43,885,415 | $53,563,584 | $58,283,580 |
| Investments | $4,640,000 | $6,695,000 | $11,151,182 |
| Miscellaneous | $1,805,966 | $2,507,700 | $3,023,113 |
| Other Financing Sources | $50,457,415 | $75,596,874 | $70,993,514 |
| TOTAL | $496,992,552 | $547,645,476 | $560,933,349 |
Expenditures by category (all funds):
| Expense Category | 2024 - 25 Budget | 2025 - 26 Budget | 2026 - 27 Budget |
|---|---|---|---|
| Personnel Services | $105,741,653 | $108,808,513 | $112,733,901 |
| Employee Benefits | $45,383,334 | $52,162,911 | $56,288,139 |
| Supplies | $12,331,651 | $13,239,916 | $12,803,435 |
| Other Operation Cost | $34,260,967 | $30,332,277 | $32,305,185 |
| Maintenance & Repair | $3,279,492 | $3,394,069 | $3,492,422 |
| Other Services & Charges | $30,855,203 | $37,399,985 | $37,600,783 |
| Contributions to Other Funds or Activities | $200,533,278 | $211,552,736 | $219,656,294 |
| Capital Outlay | $7,314,574 | $6,135,660 | $6,300,200 |
| Debt Service | $57,292,400 | $84,619,409 | $79,752,990 |
| TOTAL | $496,992,552 | $547,645,476 | $560,933,349 |
Revenues less expenses
$0 in every year - the all-funds budget is balanced.
Revenues by Source and Category
Property Tax
The County's largest source of operating revenue is property tax. Real property, automobiles, boats, trailers and income-producing personal property are subject to property tax unless specifically exempted by law. The County establishes real property values every four years. The total assessed valuation is $50,002,251,000, a $1,148,921,928 (2.35%) increase from the prior year. This includes an estimated total valuation of Real, Personal and Public Service property of $46,409,395,000 and vehicle of $3,592,856,000.
The county uses the total assessed valuation and collection rate to determine the amount of revenue generated. The recommended tax rate is $0.576 per $100 of assessed valuation - no change from the prior year. The collection rate used for the budget cannot exceed the prior year collection rate per state law. The county budgeted property tax revenue based on a conservative real property collection rate of 98.75% percent and a vehicle rate of 99.50%. Property tax revenue is also generated for the Fire Districts at their approved tax rates for each district.
Based on a 98.75% percent collection rate for real property, 99.50% rate for vehicles and an adopted tax rate of 57.6 cents, the property tax is projected to generate approximately $284,568,015 in the General Fund. Delinquent taxes and interest are estimated to generate an additional $2,072,800. The Fire Districts are estimated to generate $10,570,152 in property taxes based on their adopted rates. In total the property tax revenue for FY27 is $297,210,967, an increase of $7,494,221 (2.6%) from the prior year.
Sales/Other Taxes
The State collects sales taxes, deducts a collection fee, refunds to non-profits and returns the remaining amount to the County. Sales tax is the County's second largest source of operating revenue. Sales tax revenue totals $76,037,515. That is an increase of $1,440,223 (2%) from the prior year. Other revenue in this category includes the Cable Franchise Fee ($400,000), Gross Receipts ($595,000), Bottle Tax ($150,000) and Fire District Sales Tax ($2,257,485).
Other Financing Sources
Other Financing Sources revenues include inter-fund transfers, debt and fund balance appropriations. Other examples include a transfer of lottery proceeds from the Capital Outlay Fund for the retirement of school debt service, and occupancy taxes from the Tourism Authority. Some highlights include the following: The General Operating Fund (GF) includes one time transfer of $2,500,000 from the Internal Service Fund. GF also includes $1,960,000 of fund balance for Economic Incentive Grants. GF additionally includes $1,167,678 from Fund Balance to fund the local impact to schools funding as a result of the State proposed teacher and staff raises/bonuses. The Community Investment Fund (CIF) includes a $40,325,000 transfer from the General Fund. The CIF fund also includes the use of $10,264,990 of fund balance. Other Financing Sources revenues total $70,993,514.
Sales & Services
Charging users for specific services is a method of providing services without resorting to general tax dollars, which allows customers who receive the benefits to pay for the service. Examples include ambulance transport, landfill use and program participation fees (including the County Fair). Self Insurance/Internal Service Fund premium revenues are also included here for the Health Insurance and the Workers Comp Liability Insurance Funds. Sales & Services revenues total $58,283,580, a $4,719,996 (8.8%) increase from the prior year.
Intergovernmental - Grants/Other
Intergovernmental revenues are primarily state and federal funding and grants. Intergovernmental revenues total $31,047,723 a ($859,969) (2.7%) decrease from the prior year.
Permits and Fees
Permits and fees revenues consist primarily of Register of Deeds and Building Inspection fees. Total Permits and Fees revenues total $9,708,270, a ($124,610) (1.27%) decrease from the prior year. The Building Inspection Fees revenues total $5,400,000. Register of Deeds Fee revenues total $3,792,000. Register of Deeds Fees are largely related to the recording of documents, like the sale of property or the refinancing of a mortgage.
To learn more about the Fee Changes - check out the Fee Change section in the Supplemental Section of this book.
Miscellaneous
Miscellaneous revenues are those collected for activities of the County that may or may not be specific in nature or do not easily fit into another category. Included in this category are donations, grants from non-governmental entities, proceeds from the sale of fixed assets, and the Opioid Settlement Funds. Insurance Rebates for Health Self Insurance Fund are also included here. Miscellaneous revenues total $3,023,113, a $515,413 (20.55%) increase from the prior year.
Investment Earnings
Investment Earnings are revenues earned on funds invested by the county. Investment earning revenues total $11,151,182, a $4,456,182 (66.56%) increase from the prior year. This is the result of higher interest rate environment.
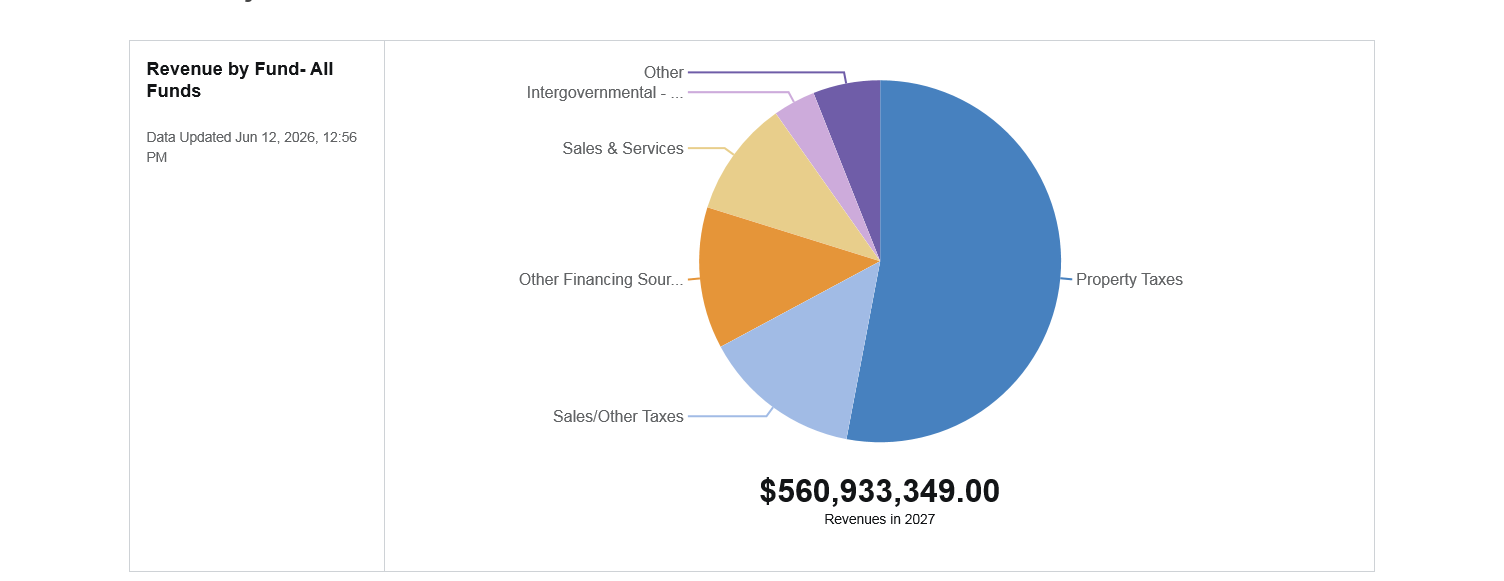
Revenues by Fund
The County allocates revenues to the following funds:
- General Fund
- Community Investment Fund (CIF)
- Self-Insured / Dental Fund
- Fire Districts Fund
- Workers' Compensation and Liability Fund
- Landfill Fund
- Intergovernmental Fund
- Arena and Events Center Fund
- 911 Emergency Telephone System Fund
- Social Services Fund
- Opioid Settlement Fund
Proposed Revenue by Fund - All Funds
How each revenue source is budgeted across the funds for FY 2026-27 (figures in the All Funds column are the countywide totals):
| Revenue Source | All Funds | General Fund | Community Investment Fund | Self-Insured Fund | Fire Districts Fund | Workers Comp/Liability Fund | Opioid Settlement Fund |
|---|---|---|---|---|---|---|---|
| Property Taxes | $297,210,967 | $286,640,815 | $0 | $0 | $10,570,152 | $0 | $0 |
| Sales/Other Taxes | $79,515,000 | $50,156,000 | $29,284,000 | $0 | $0 | $0 | $0 |
| Intergovernmental - Grants - Human Services | $21,249,663 | $21,249,663 | $0 | $0 | $0 | $0 | $0 |
| Intergovernmental - Grants - Other | $3,197,410 | $2,788,410 | $404,000 | $0 | $0 | $0 | $0 |
| Intergovernmental - Other | $6,600,650 | $6,546,650 | $0 | $0 | $0 | $0 | $0 |
| Permits & Fees | $9,708,270 | $9,498,270 | $0 | $0 | $0 | $0 | $0 |
| Sales & Services | $58,283,580 | $22,929,229 | $0 | $25,729,766 | $0 | $4,077,992 | $0 |
| Investments | $11,151,182 | $7,000,000 | $3,876,182 | $100,000 | $0 | $75,000 | $0 |
| Miscellaneous | $3,023,113 | $750,375 | $0 | $1,164,738 | $0 | $0 | $1,100,000 |
| Other Financing Sources | $70,993,514 | $6,013,409 | $56,239,990 | $115,412 | $0 | $3,234,008 | $2,619,426 |
| TOTAL | $560,933,349 | $413,572,821 | $89,804,172 | $27,109,916 | $10,570,152 | $7,387,000 | $3,719,426 |
Proposed Revenue by Fund - Other Funds
The same revenue sources for the county's remaining funds (FY 2026-27):
| Revenue Source | Landfill Fund | Arena/Fair Fund | Intergovernmental Fund | Social Services Fund | 911 Fund |
|---|---|---|---|---|---|
| Property Taxes | $0 | $0 | $0 | $0 | $0 |
| Sales/Other Taxes | $75,000 | $0 | $0 | $0 | $0 |
| Intergovernmental - Grants - Human Services | $0 | $0 | $0 | $0 | $0 |
| Intergovernmental - Grants - Other | $5,000 | $0 | $0 | $0 | $0 |
| Intergovernmental - Other | $54,000 | $0 | $0 | $0 | $0 |
| Permits & Fees | $210,000 | $0 | $0 | $0 | $0 |
| Sales & Services | $2,088,500 | $692,300 | $1,800,000 | $500,000 | $465,793 |
| Investments | $0 | $90,000 | $0 | $0 | $10,000 |
| Miscellaneous | $0 | $8,000 | $0 | $0 | $0 |
| Other Financing Sources | $752,783 | $2,018,486 | $0 | $0 | $0 |
| TOTAL | $3,185,283 | $2,808,786 | $1,800,000 | $500,000 | $475,793 |
Expenditures
The following three sections present expenditures by fund, category, function and department.
Expenditures by Fund
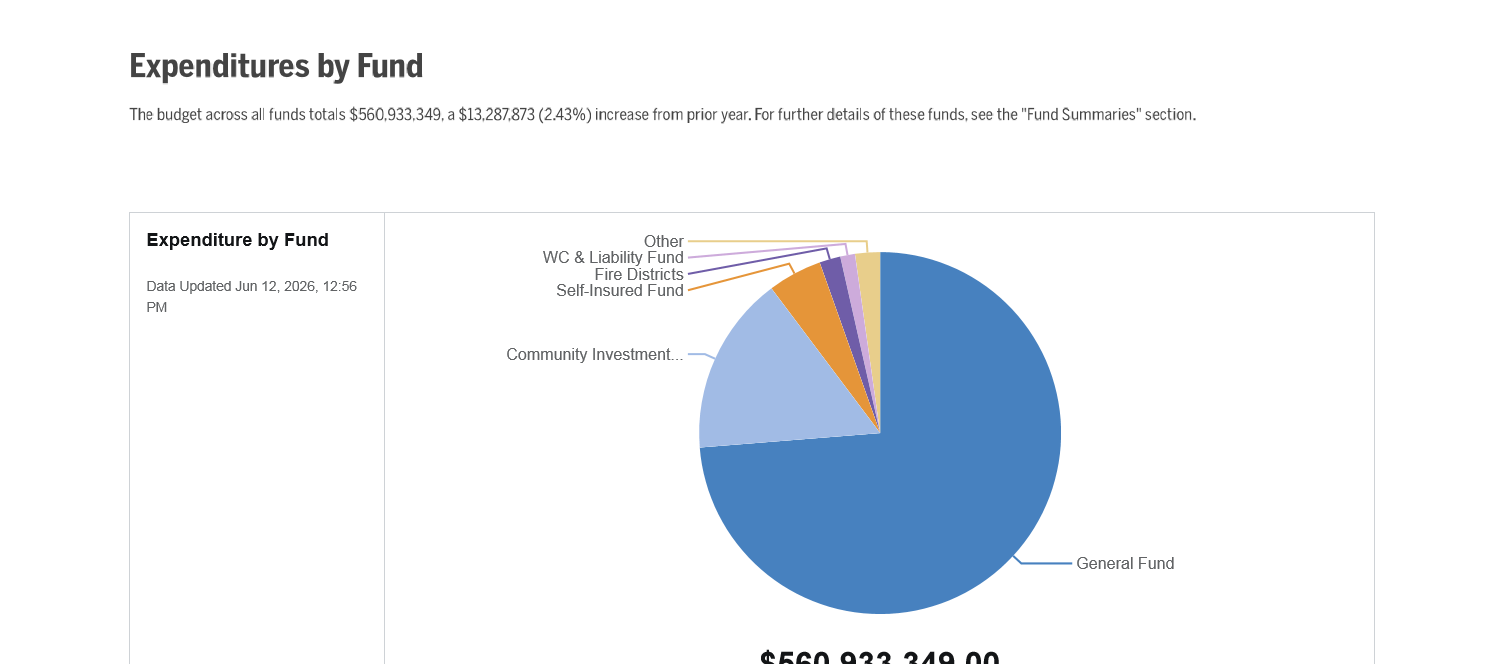
The budget across all funds totals $560,933,349, a $13,287,873 (2.43%) increase from prior year. For further details of these funds, see the "Fund Summaries" section.
Expenditure by Category
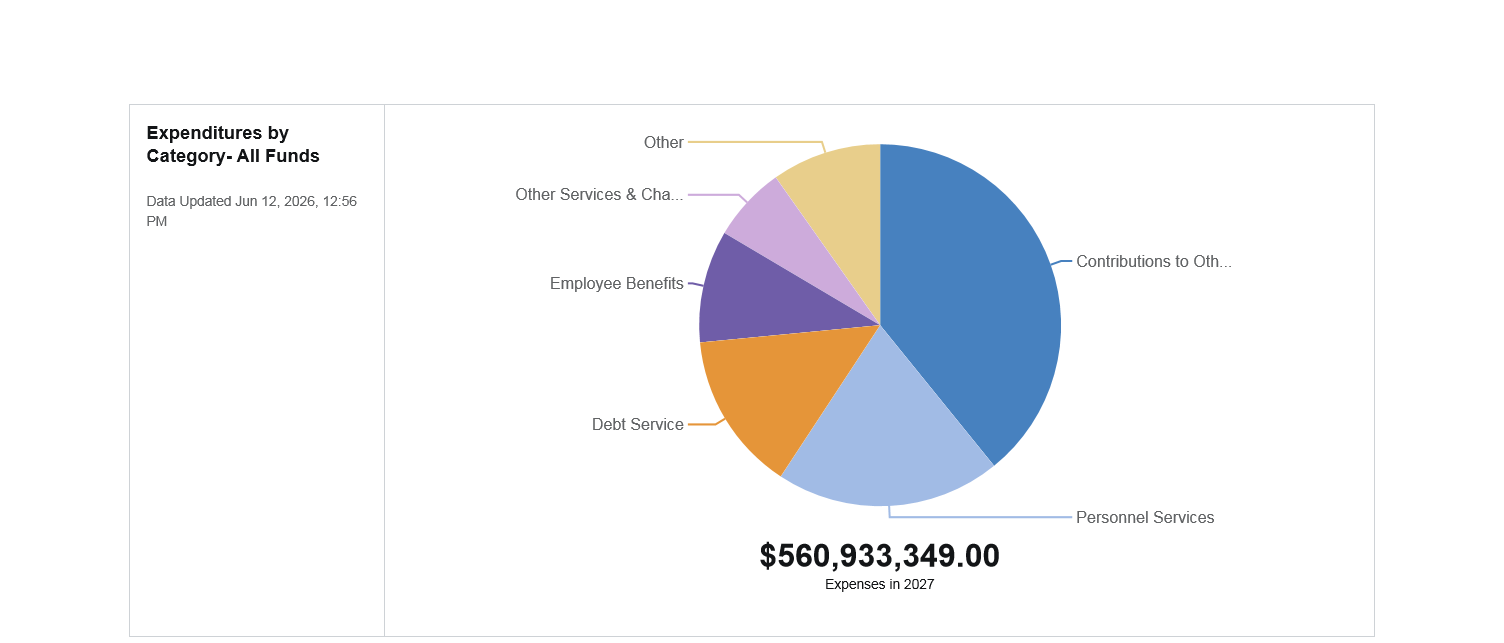
Personnel Services
Personnel Services
include all expenditures associated with employment including salaries and benefits. The Cabarrus County Personnel Management Policycalls for annual cost-of-living salary adjustments (COLA)and merit pay raises based on performance. The budget provides a one percent COLA and merit pay raises of up to four percent. Personnel Services expenditures total $169,022,040, a $8,050,616 (5%) increase from the prior year. The increase includes the addition of 16 new Detention Center positions for a new pod, 5 new Sheriff Office positions and a reclassification of one position for 24/7 security coverage at the new Behavioral Health Center and Progress Place. Details of the new positions and reclassification are shown in the Position Summary section of the budget book.
Employee Benefits
Healthcare - the budget includes an additional $2,065,719, a 10.61% increase from the prior year. Retirement - the budget includes an additional $1,465,898, a 9.65% increase from the prior year. The county is required to make a contribution based on a percentage of each employee's salary to the North Carolina Local Government Employees' Retirement System. For FY27, the annual contribution for law enforcement officers is 17.10% and the rate for general employees is 15.13%.
Operations
Operations
include all expenses, outside of personnel, required to provide service. Examples include office supplies, technology, equipment, uniforms, fuel and utilities. Operations expenditures total $305,858,119, a $9,939,136 (3.36%) increase from the prior year. Significant increases include: Education Funding - the budget includes an additional $6,483,995 for Cabarrus County Schools (CCS) to fund rising costs of locally paid staff, and operational cost including facility & grounds maintenance. Kannapolis City Schools (KCS) received an additional $902,027 to also fund the rising costs of locally paid staff, technology and other operational expenses.
The CCS and KCS Charter Schools also receive equivalent funding based on their student Average Daily Membership (ADM) increasing their funding by $448,826. The school totals includes non-recurring funds for the local impact of State proposed teacher and staff bonuses (CCS $871,034; KCS $100,895; CCS & KCS Charter Schools $82,262). Rowan Cabarrus Community College will receive an increase of $220,658. In total, Education will receive just over $136.1 million for operations - an increase of $8.07 million (6.3%).
Cabarrus Health Alliance (CHA) - the budget includes an additional $505,994 (4%) increase from the prior year. The budget funds a major portion of the inflationary and merit increases for CHA staff, nurses for the school nurse program and the behavioral health program for the Cabarrus County Detention Center.
Capital Outlay
Capital Outlay
includes capital purchases between $5,000 and $99,999. Examples include equipment, vehicles, and furniture. Capital Outlay expenditures total $6,300,200, a $164,540 (2.68%) increase from the prior year.
Expenditures by Category - All Funds
| Expense Category | 2024 - 25 Budget | 2025 - 26 Budget | 2026 - 27 Budget |
|---|---|---|---|
| Personnel Services | $105,741,653 | $108,808,513 | $112,733,901 |
| Employee Benefits | $45,383,334 | $52,162,911 | $56,288,139 |
| Supplies | $12,331,651 | $13,239,916 | $12,803,435 |
| Other Operation Cost | $34,260,967 | $30,332,277 | $32,305,185 |
| Maintenance & Repair | $3,279,492 | $3,394,069 | $3,492,422 |
| Other Services & Charges | $30,855,203 | $37,399,985 | $37,600,783 |
| Contributions to Other Funds or Activities | $200,533,278 | $211,552,736 | $219,656,294 |
| Capital Outlay | $7,314,574 | $6,135,660 | $6,300,200 |
| Debt Service | $57,292,400 | $84,619,409 | $79,752,990 |
| TOTAL | $496,992,552 | $547,645,476 | $560,933,349 |
Expenditures by Function
Expenditures are budgeted across nine functions:
Expenditures by Function - All Funds
| Function | 2024 - 25 Budget | 2025 - 26 Budget | 2026 - 27 Budget |
|---|---|---|---|
| Education | $116,461,918 | $130,656,530 | $139,209,055 |
| Public Safety | $101,868,201 | $107,853,950 | $114,577,210 |
| Debt Service | $64,271,982 | $87,819,409 | $84,979,172 |
| General Government | $71,825,896 | $78,546,896 | $79,755,532 |
| Human Services | $66,211,409 | $70,279,176 | $71,764,057 |
| Contributions | $53,435,084 | $47,304,823 | $45,495,082 |
| Culture & Recreation | $13,258,506 | $14,185,312 | $14,818,257 |
| Economic & Physical Development | $7,212,078 | $8,093,106 | $7,149,701 |
| Environmental Protection | $2,447,478 | $2,906,274 | $3,185,283 |
| TOTAL | $496,992,552 | $547,645,476 | $560,933,349 |
Expenditure by Function
Education/School Debt
The total budget for Education including debt services $184,077,045. As noted earlier $136,143,899 of the Education funding is for operations. Education related debt service totaling $44,867,990 for Cabarrus County Schools (CCS), Kannapolis City Schools (KCS), Rowan-Cabarrus Community College (RCCC) contributions funds the acquisition and construction of capital assets. The Capital Outlay funding for CCS, KCS and RCCC is $1,220,000. Technology support provided by the County for CCS and KCS of $45,156. The total also includes $1,800,000 of pass through funds for Fines and Forfeitures that are collected by the County, but paid to Cabarrus County Schools, Kannapolis City Schools and associated legal fees.
Public Safety
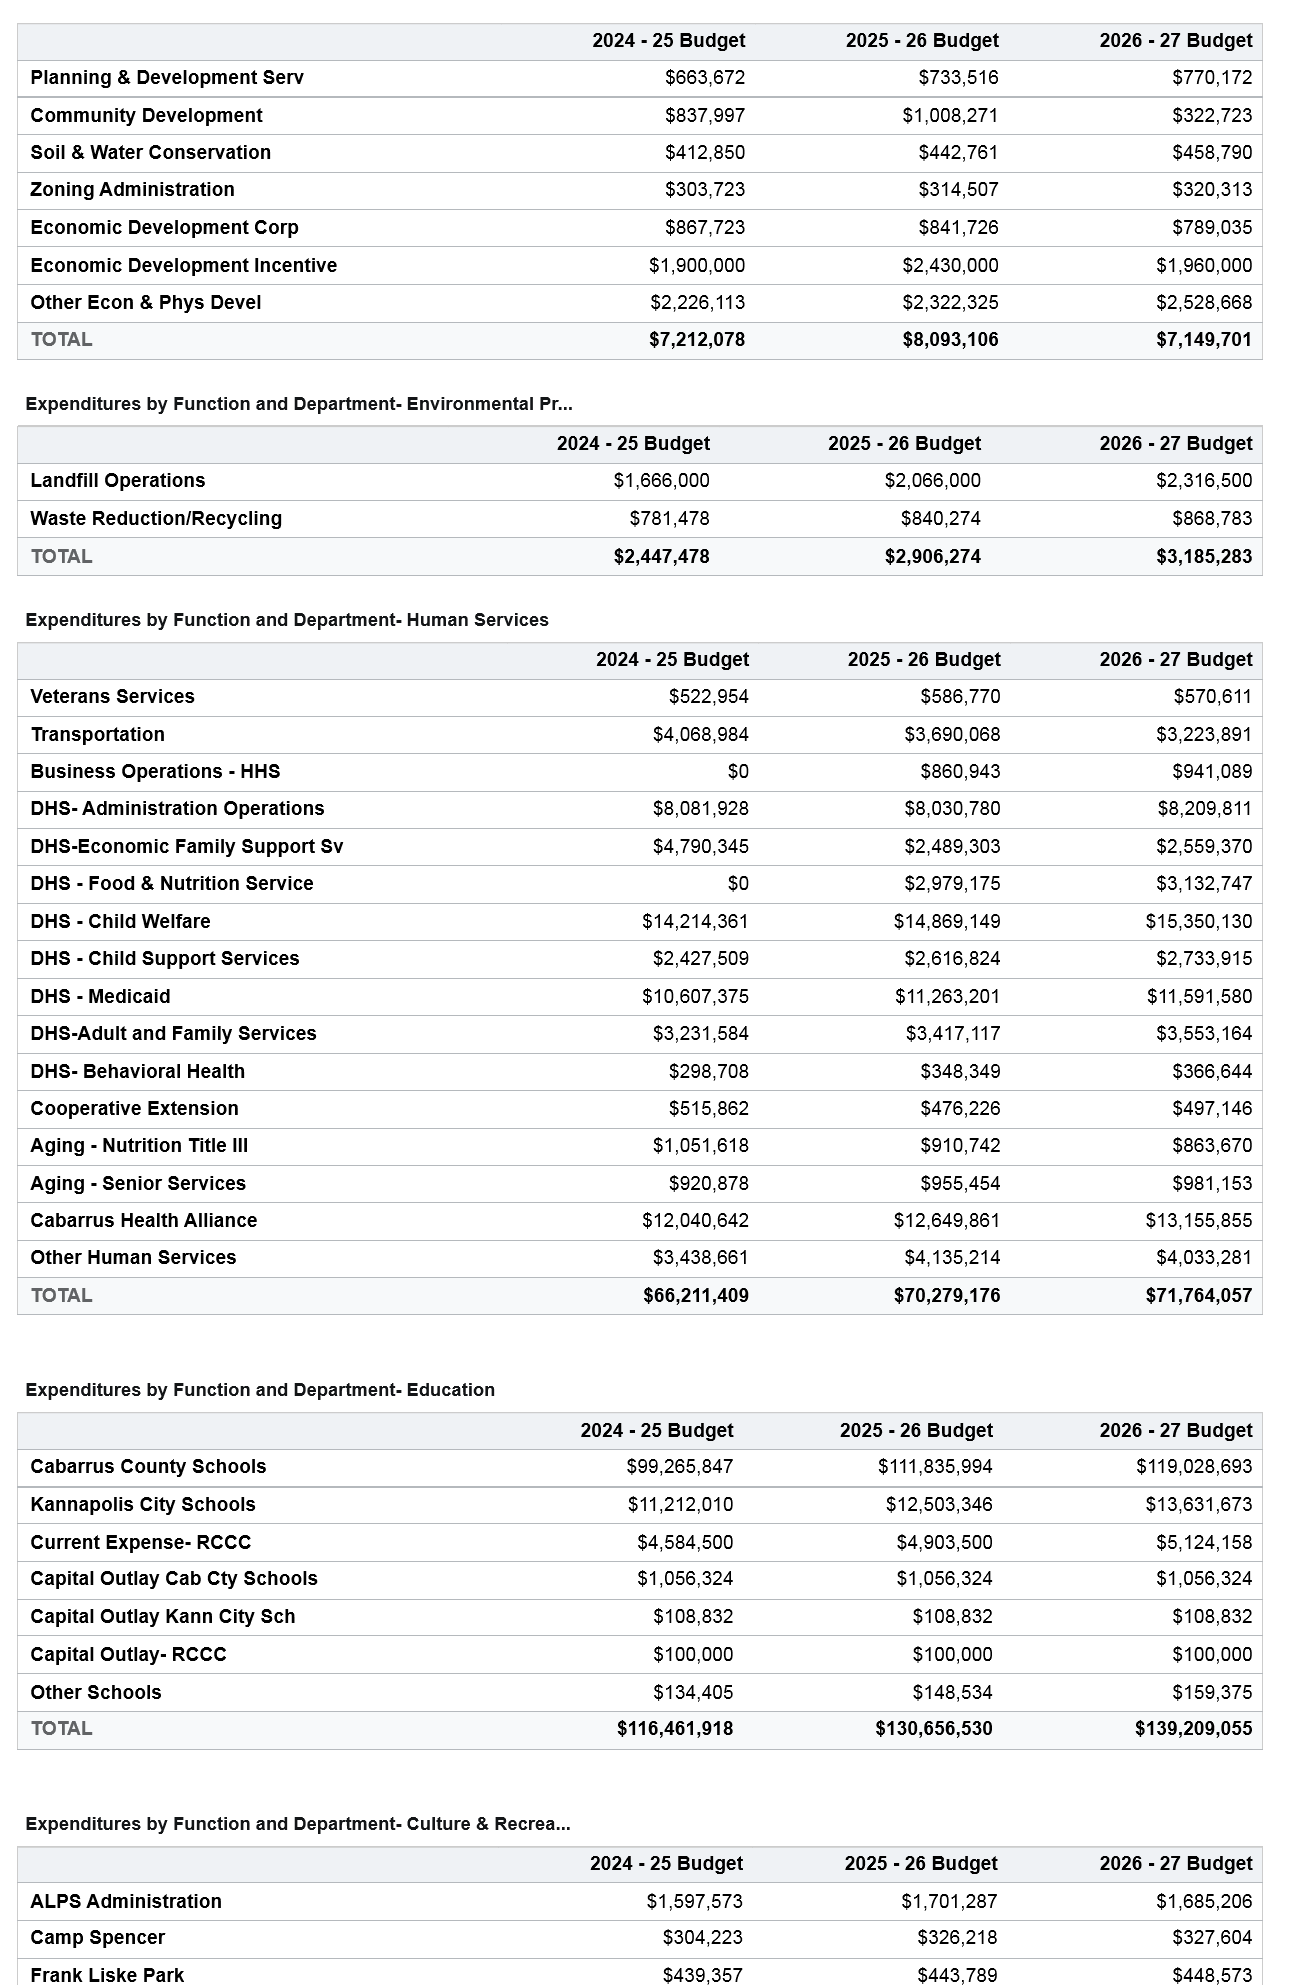
The budget for Public Safety is $114,577,210 an increase of $6,723,260 (6.23%) from the prior year. Public Safety expenditures provide safety and security for the public. This section includes the Sheriff's Department, which includes services such as the Jail, Animal Control and Animal Shelter. Other departments included in this category are Courts, Construction Standards, Emergency Management, Emergency Medical Services and the 911 Emergency Telephone System Fund. Beginning with the FY24 budget the Sheriff's Office budget added separate divisions (departments) to account for deputies provided to Towns of Harrisburg, Midland and Mount Pleasant. In addition, a separate division has also been created to account for staff provided as School Resource Officers to Cabarrus County Schools. For FY27 an additional division (department) for Communications was created for the Sheriff's Office. Included in this increase are funds for the opening of a new pod for the Detention Center (16 new positions), as well as 24/7 security coverage for the Behavioral Health Center (BHC) and Progress Place (5 new positions and one reclassification) for the Sheriff's Office. The cost of the security positions will be partially offset by reimbursement from BHC Operator and state Social Services grant funding.
General Government
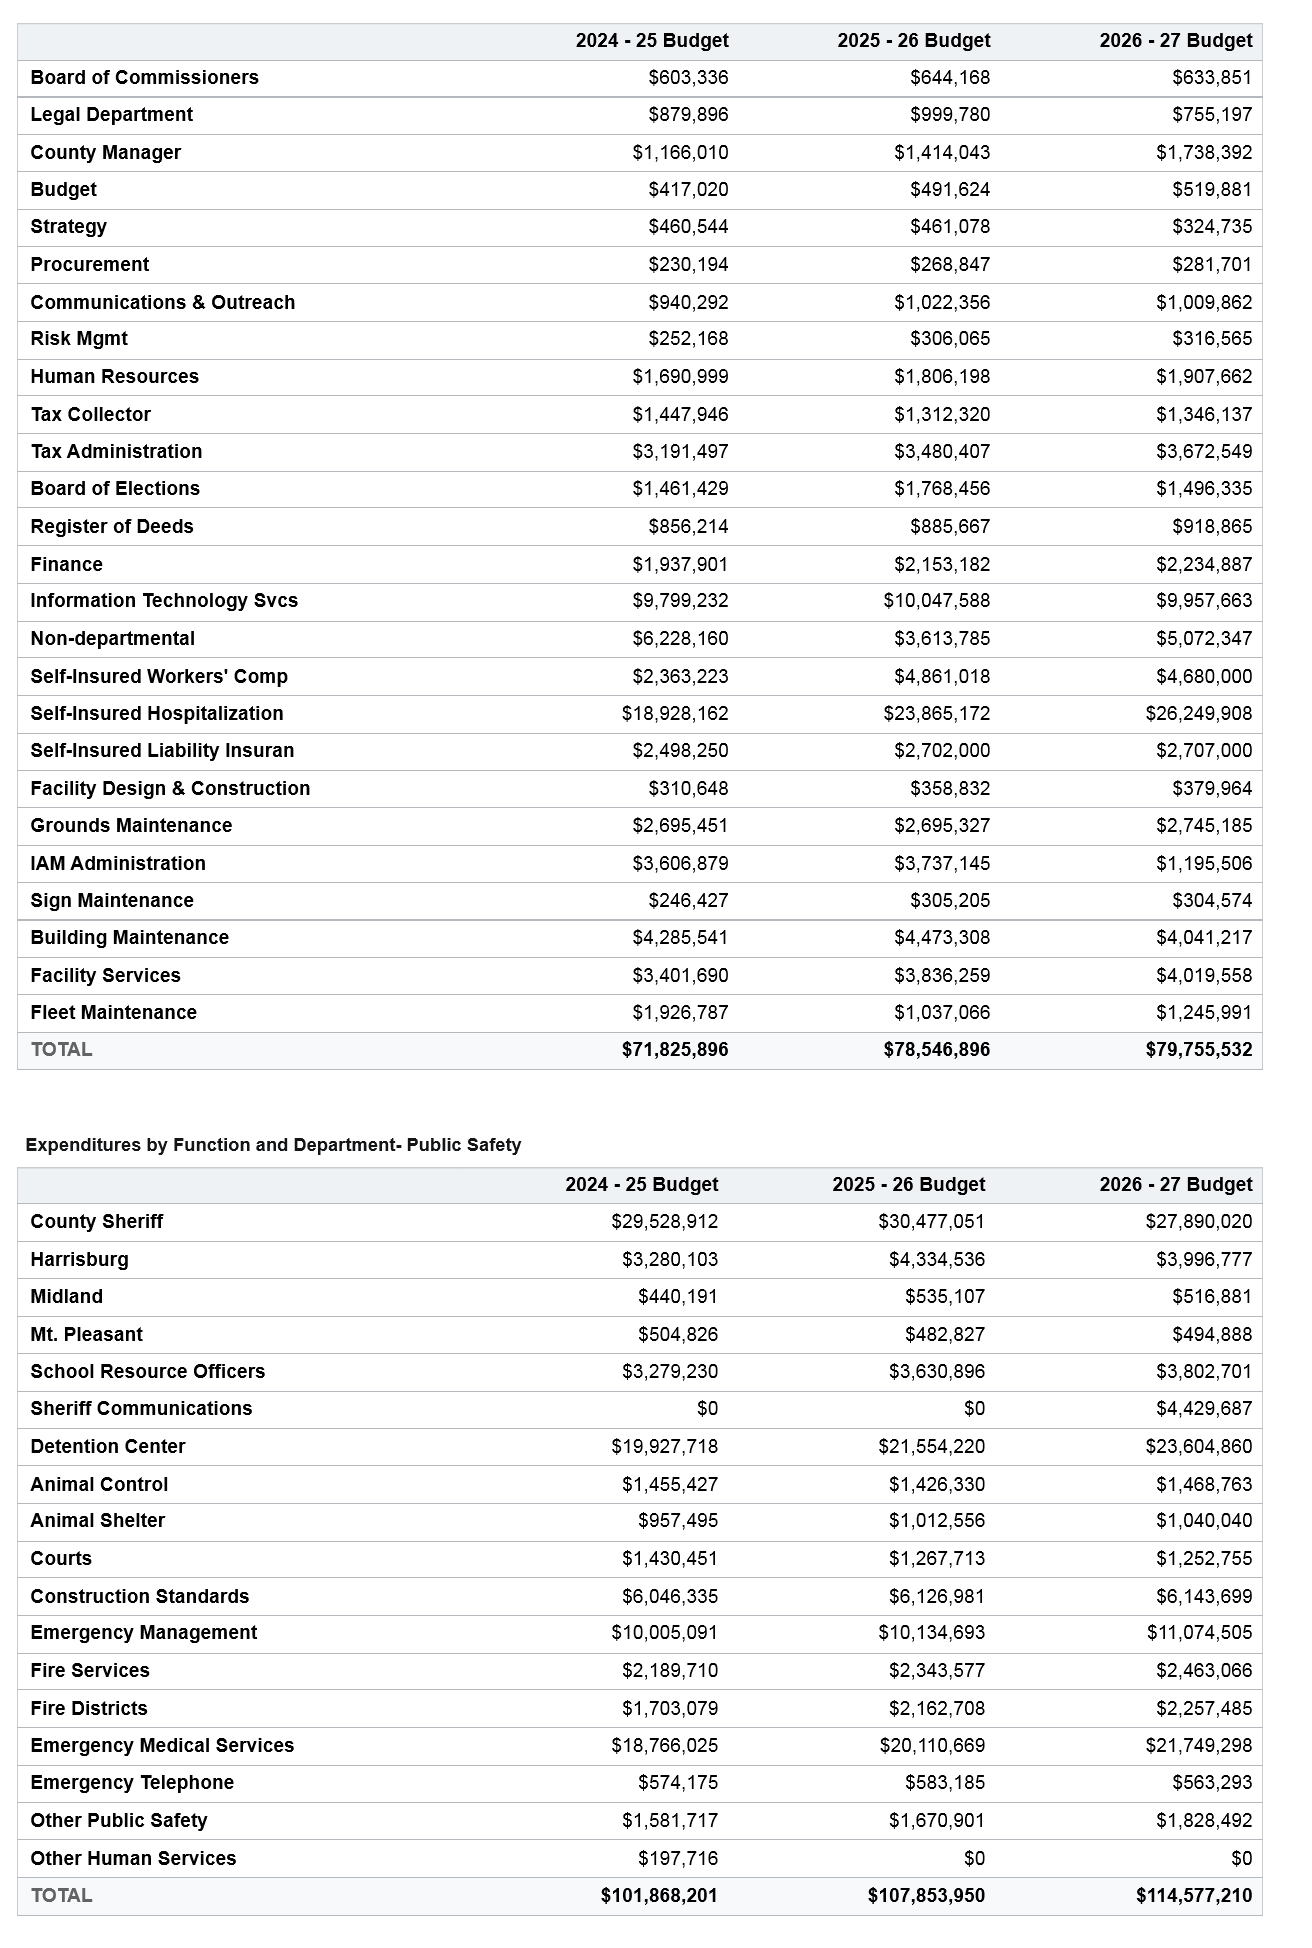
The budget for General Government is $79,755,532, a $1,208,636 (1.54%) increase from the prior year. The General Government Service area accounts for county services for the benefit of the public and the governmental body as a whole. This service area includes: Board of Commissioners, County Manager's Office, Budget, Strategy, Procurement, Safety & Risk and Facility Design & Construction, Communications and Outreach, Human Resources, Tax Collection and Administration, Board of Elections, Register of Deeds, Finance, Information Services, Infrastructure and Asset Management, Health and Dental Insurance and Non-departmental, which includes programs that relate to the General Fund and not a particular department. For FY2027 Longevity Pay and Lapse Salary previously budgeted in the General Government has been allocated to the respective functional areas based on prior use data.
Contributions
The budget for Contribution to Other Funds is $45,495,082, a $1,809,741 (-3.83%) decrease from the prior year. Contributions include expenditures to other funds such as the Community Investment Fund, Capital Project, Landfill, and Arena.
Human Services
The budget for Human Services is $71,764,057, a $1,484,881 (2.11%) increase from the prior year. Human Services expenditures are those that promote general health and well-being of the individuals within the community. This area includes Veterans Services, Medicaid and Senior Transportation, Cooperative Extension, Economic Social Services, Aging Services, Child Welfare, Child Support, Behavioral Health and the Cabarrus Health Alliance.
Non-Education Debt Service
The budget for Non-Education Debt Services is $40,111,182 a $817,239 (2.08%) increase from the prior year. Other debt service accounts for principal and interest payments on debt, other than school debt.
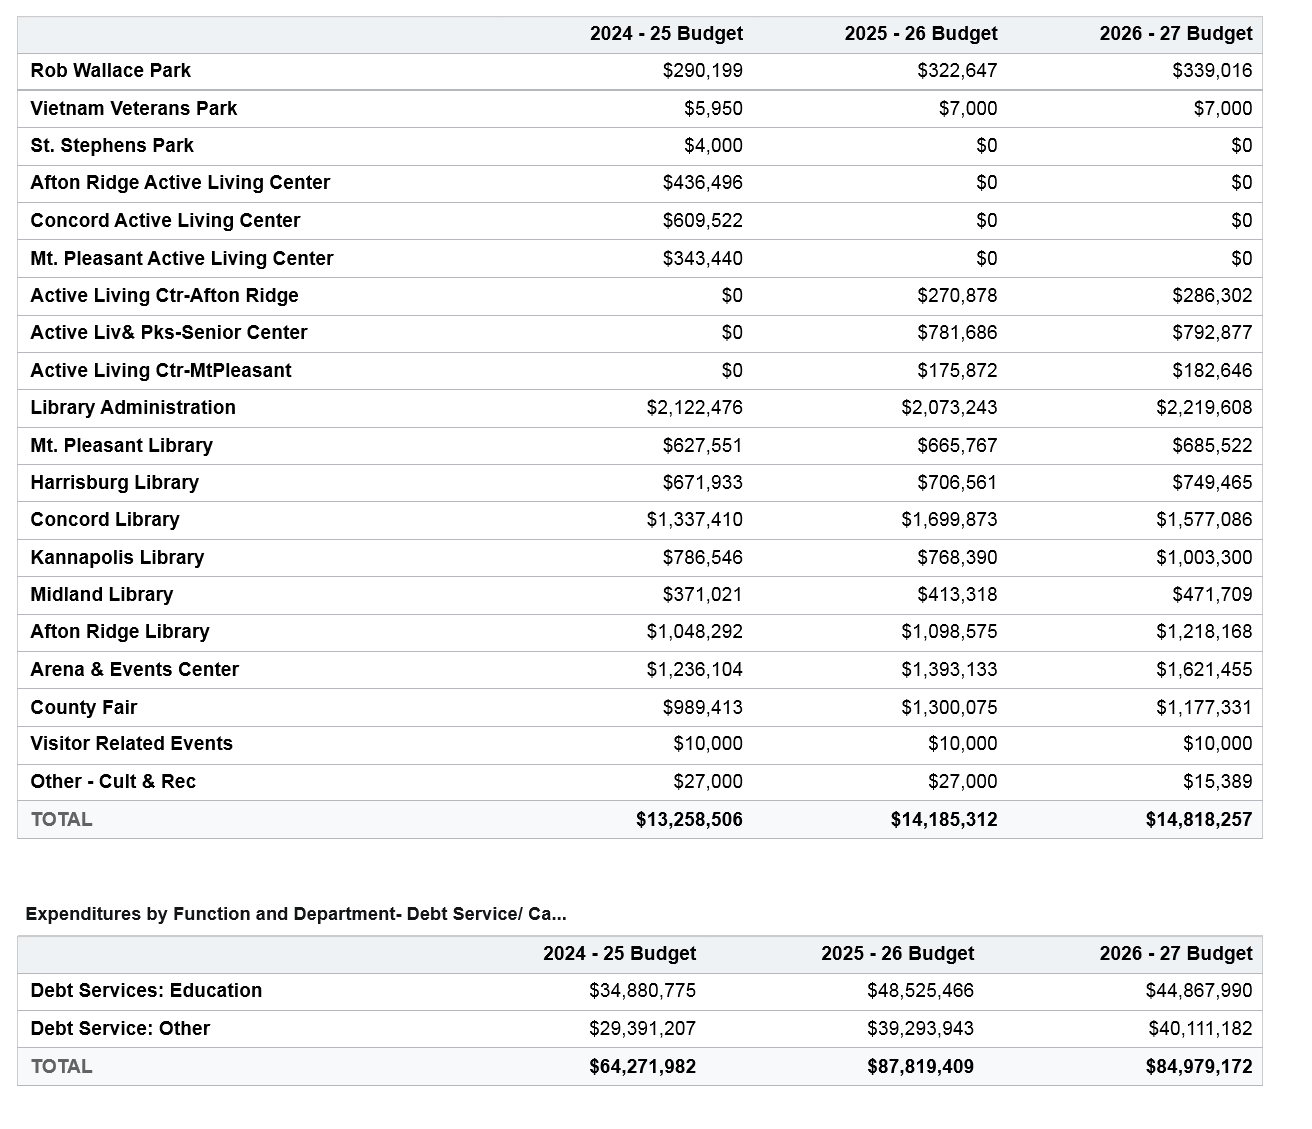
Culture and Recreation
The budget for Culture and Recreation is $14,818,257, a $632,945 (4.46%) increase from the prior year. Culture and Recreation expenditures provide residents with opportunities and facilities for cultural, recreational and educational programs. These opportunities include programming at the senior center, county parks, Cabarrus Arena and Events Center, Fair and Libraries.
Economic and Physical Development
The budget for Economic and Physical Development is $7,149,701, a $943,405 (-11.66%) decrease from the prior year. The Economic and Physical Development service area provides for the orderly planning of growth and development, along with incentives to drive economic growth in the County. This area includes Planning and Development, Community Development, Soil and Water Conservation, Zoning Administration, Economic Development Incentives and Economic Development Corporation (EDC). The decrease is a result of timing of the Economic Incentive Grants, a reduction of County's contribution to the EDC, and a reduction of some Community Development Grants.
Environmental Protection
The budget for Environmental Protection is $3,185,283, a $279,009 (9.6%) increase from the prior year. Environmental Protection services provide environmental safety and quality. These services include the Landfill and Waste Reduction/Recycling departments.
Expenditures by Function and Department - Contributions
| Department | 2024 - 25 Budget | 2025 - 26 Budget | 2026 - 27 Budget |
|---|---|---|---|
| Contributions | $8,556,242 | $4,870,848 | $3,605,000 |
| Self Insured Dental | $613,000 | $800,000 | $860,008 |
| Cost to Other Funds | $44,265,842 | $41,633,975 | $40,581,252 |
| Other Human Services | $0 | $0 | $448,822 |
| TOTAL | $53,435,084 | $47,304,823 | $45,495,082 |
Expenditures by Fund and Function
How each function's spending is distributed across the funds for FY 2026-27 (the All Funds column is the countywide total):
| Function | All Funds | General Fund | Community Investment Fund | Self-Insured Fund | Fire Districts Fund | Workers Comp/Liability Fund | Opioid Settlement Fund |
|---|---|---|---|---|---|---|---|
| Education | $139,209,055 | $136,189,055 | $1,220,000 | $0 | $0 | $0 | $0 |
| Public Safety | $114,577,210 | $103,531,265 | $0 | $0 | $10,570,152 | $0 | $0 |
| Debt Service | $84,979,172 | $0 | $84,979,172 | $0 | $0 | $0 | $0 |
| General Government | $79,755,532 | $46,118,624 | $0 | $26,249,908 | $0 | $7,387,000 | $0 |
| Human Services | $71,764,057 | $67,993,453 | $0 | $0 | $0 | $0 | $3,270,604 |
| Contributions | $45,495,082 | $40,581,252 | $3,605,000 | $860,008 | $0 | $0 | $448,822 |
| Culture & Recreation | $14,818,257 | $12,009,471 | $0 | $0 | $0 | $0 | $0 |
| Economic & Physical Development | $7,149,701 | $7,149,701 | $0 | $0 | $0 | $0 | $0 |
| Environmental Protection | $3,185,283 | $0 | $0 | $0 | $0 | $0 | $0 |
| TOTAL | $560,933,349 | $413,572,821 | $89,804,172 | $27,109,916 | $10,570,152 | $7,387,000 | $3,719,426 |
The same functions across the county's remaining funds:
| Function | Landfill Fund | Arena/Fair Fund | Intergovernmental Fund | Social Services Fund | 911 Fund |
|---|---|---|---|---|---|
| Education | $0 | $0 | $1,800,000 | $0 | $0 |
| Public Safety | $0 | $0 | $0 | $0 | $475,793 |
| Debt Service | $0 | $0 | $0 | $0 | $0 |
| General Government | $0 | $0 | $0 | $0 | $0 |
| Human Services | $0 | $0 | $0 | $500,000 | $0 |
| Contributions | $0 | $0 | $0 | $0 | $0 |
| Culture & Recreation | $0 | $2,808,786 | $0 | $0 | $0 |
| Economic & Physical Development | $0 | $0 | $0 | $0 | $0 |
| Environmental Protection | $3,185,283 | $0 | $0 | $0 | $0 |
| TOTAL | $3,185,283 | $2,808,786 | $1,800,000 | $500,000 | $475,793 |